Stimulus visualization
The visualization submodule provides methods for visualizing stimuli.
Timedomain visualization
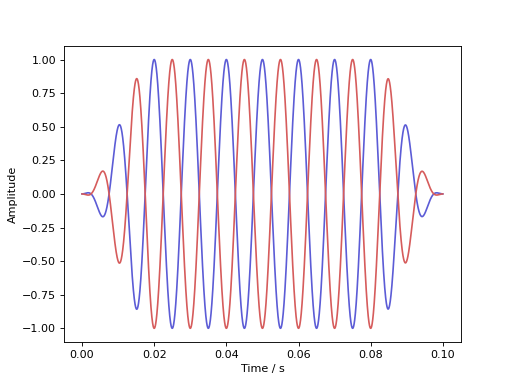
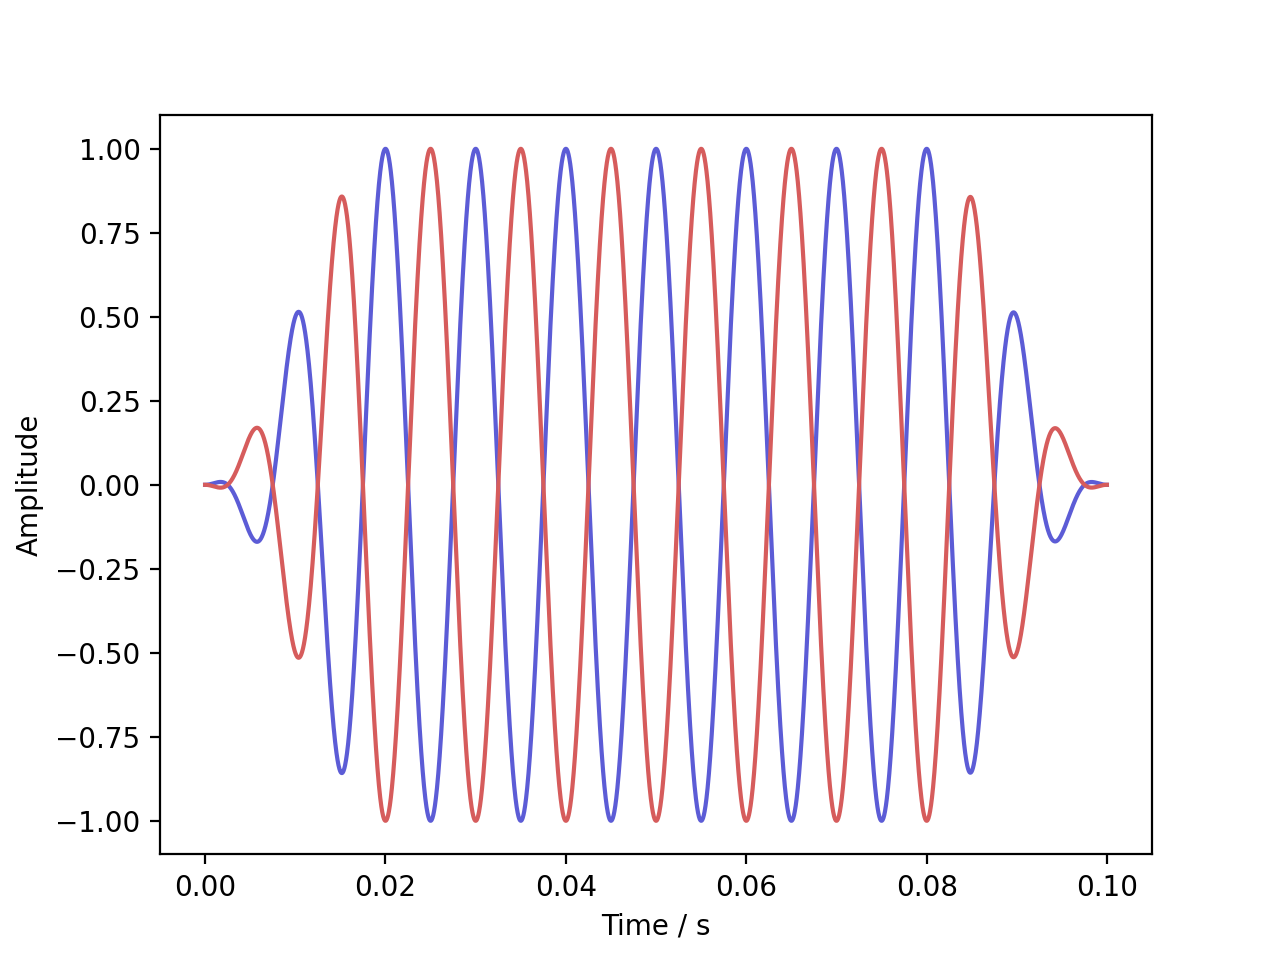
The audiotoolbox.viz.Visualization.plot() method allows for a quick visualization of the timedomain signal.
sig = audio.Signal(2, 100e-3, 48000)
sig.ch[0].add_tone(100)
sig.ch[1].add_tone(100, start_phase=np.pi)
sig.add_fade_window(20e-3)
fig, ax = sig.viz.plot()
fig.show()
(Source code, png, hires.png, pdf)

Frequency domain visualization
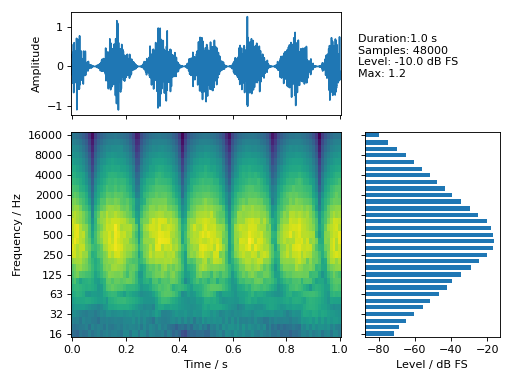
The audiotoolbox.viz.Visualization.spectrum() method allows for quick visualization of the stimulus spectrum.
sig = (
audio.Signal(1, 1, 48000)
.add_noise("pink")
.bandpass(1000, 500, "butter", order=2)
.add_cos_modulator(6, 1)
.set_dbfs(-10)
)

fig, ax = sig.viz.spectrum(single_sided=True, in_db=True)
fig.show()
(Source code, png, hires.png, pdf)

Signal Overview
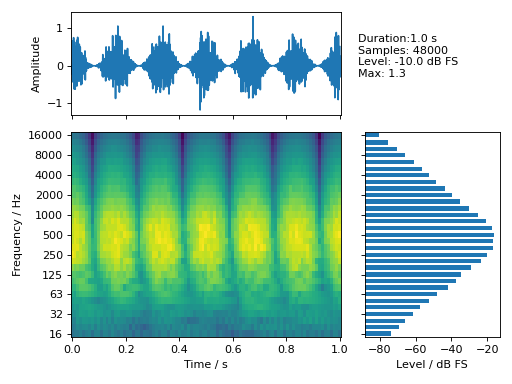
The audiotoolbox.viz.Visualization.specgram_overview() method shows an overview with the time-domain
signal, a 1/3-octave-band spectrogram, and 1/3-octave-band levels.
sig = (
audio.Signal(1, 1, 48000)
.add_noise("pink")
.bandpass(500, 500, "butter", order=2)
.add_cos_modulator(6, 1)
.set_dbfs(-10)
)
fig, ax = sig.viz.specgram_overview()
fig.show()
(Source code, png, hires.png, pdf)
